

Example
You should spend about 20 minutes on this task.
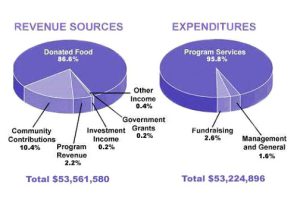
The pie chart shows the amount of money that a children’s charity located in the USA spent and received in one year, 2016.
Summarise the information by selecting and reporting the main features and make comparisons where relevant.
Write at least 150 words.
Model Answer
The two pie charts illustrate the sources of income and the distribution of expenditure for a children’s charity in the USA in 2016.
Overall, donated food accounted for by far the largest proportion of the charity’s income, while almost all of its expenditure was allocated to programme services. Notably, total income was slightly higher than total spending.
In terms of revenue, donated food represented 86.6% of the total, making it the dominant source of funding. Community contributions were the second-largest source, at 10.4%, followed by programme revenue at 2.2%. By comparison, investment income, government grants and other income each contributed less than 1%, at 0.2%, 0.2% and 0.4% respectively. The charity received a total of $53,561,580 during the year.
Regarding expenditure, 95.8% of the $53,224,896 total was spent on programme services. Fundraising accounted for 2.6%, while management and general expenses made up the remaining 1.6%. Thus, the charity spent approximately $337,000 less than it received, leaving a small surplus at the end of the year.
Breakdown
1. Task Achievement
What you did well:
- You clearly identified the main features of both pie charts.
- Your overview is effective:
- “donated food accounted for by far the largest proportion”
- “almost all of its expenditure was allocated to programme services”
- You also identified the difference between total income and expenditure.
- You included specific figures for all the important categories.
- Comparisons are appropriate, particularly:
- donated food vs. other income sources
- programme services vs. fundraising/management
- total income vs. total expenditure.
- You avoided unnecessary explanations or speculation.
Coherence & Cohesion
Strengths:
- Excellent four-paragraph structure:
- Introduction
- Overview
- Income
- Expenditure
- Information progresses logically.
- Paragraphing is clear and appropriate.
- Linking expressions are used naturally:
- “Overall”
- “In terms of revenue”
- “By comparison”
- “Regarding expenditure”
- “Thus”
- You don’t overuse basic connectors such as firstly, secondly, moreover, furthermore.
Lexical Resource
You demonstrate a strong range of vocabulary appropriate to Task 1.
Good choices include:
- “sources of income”
- “distribution of expenditure”
- “accounted for”
- “proportion”
- “dominant source of funding”
- “community contributions”
- “investment income”
- “government grants”
- “allocated to”
- “programme services”
- “fundraising”
- “surplus”
You also avoid excessive repetition of money, income, spent, etc.
One vocabulary/grammar point to fix
Your introduction says:
“the sources of income and the distribution of expenditure for a children’s charity”
This is understandable, but a slightly more natural formulation would be:
“the sources of income and expenditure of a children’s charity”
or:
“the income sources and expenditure of a children’s charity”
Also:
“donated food accounted for by far the largest proportion”
is grammatically possible, but “accounted for by far the largest proportion of income” is clearer.
Grammatical Range & Accuracy
This is one of the strongest aspects of your writing.
You use:
- complex sentences
- participial structures
- comparative structures
- accurate percentages
- appropriate past tense
- subordinate clauses.
For example:
“Community contributions were the second-largest source, at 10.4%, followed by programme revenue at 2.2%.”
This is concise and grammatically controlled.
Another strong sentence:
“Thus, the charity spent approximately $337,000 less than it received, leaving a small surplus at the end of the year.”
The structure “…, leaving…” is used accurately and naturally.
Sentence-by-Sentence Assessment
Introduction
“The two pie charts illustrate the sources of income and the distribution of expenditure for a children’s charity in the USA in 2016.”
Score: Very good.
Clear paraphrase of the task. No unnecessary detail.
Overview
“Overall, donated food accounted for by far the largest proportion of the charity’s income, while almost all of its expenditure was allocated to programme services.”
Excellent.
This identifies the two dominant features immediately.
“Notably, total income was slightly higher than total spending.”
Good.
This is a useful overall comparison.
Income paragraph
“In terms of revenue, donated food represented 86.6% of the total, making it the dominant source of funding.”
Excellent. Clear figure + interpretation.
“Community contributions were the second-largest source, at 10.4%, followed by programme revenue at 2.2%.”
Excellent. Effective ranking and comparison.
“By comparison, investment income, government grants and other income each contributed less than 1%, at 0.2%, 0.2% and 0.4% respectively.”
Very good. Accurate, although it could be slightly clearer stylistically.
“The charity received a total of $53,561,580 during the year.”
Good. Relevant and accurate if this figure is provided in the chart.
Expenditure paragraph
“Regarding expenditure, 95.8% of the $53,224,896 total was spent on programme services.”
Excellent. Very precise.
“Fundraising accounted for 2.6%, while management and general expenses made up the remaining 1.6%.”
Excellent. Concise comparison.
“Thus, the charity spent approximately $337,000 less than it received, leaving a small surplus at the end of the year.”
Very good. Strong concluding comparison.
Leave a Reply