

Example
You should spend about 20 minutes on this task.
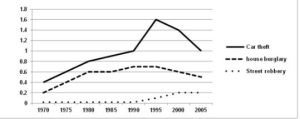
The chart below shows three different types of crime in England and Wales from 1970 to 2005.
Summarise the information by selecting and reporting the main features and make comparisons where relevant.
Write at least 150 words.
Model Answer
The line graph illustrates changes in the incidence of car theft, house burglary and street robbery in England and Wales between 1970 and 2005.
Overall, car theft was consistently the most prevalent crime and experienced the most dramatic rise and fall. House burglary followed a similar, though less pronounced, pattern, while street robbery remained comparatively uncommon throughout the period.
In 1970, car theft stood at approximately 0.4 million cases, twice the figure for house burglary, at 0.2 million. Car theft then increased steadily, reaching 0.8 million in 1980 and 1.0 million in 1990, before peaking at 1.6 million in 1995. It subsequently declined to around 1.0 million by 2005.
House burglary rose from 0.2 million in 1970 to about 0.6 million in 1980, remaining relatively stable until 1990. It then climbed to roughly 0.7 million in 1995, before falling gradually to 0.5 million in 2005. Street robbery recorded almost no cases until 1990, after which it increased steadily to approximately 0.2 million in 2000 and remained unchanged through 2005.
Break down
Task Achievement
Excellent overview
Your overview is very strong:
“Overall, car theft was consistently the most prevalent crime and experienced the most dramatic rise and fall.”
This immediately identifies the highest category and most significant trend.
You then compare the other two:
“House burglary followed a similar, though less pronounced, pattern, while street robbery remained comparatively uncommon throughout the period.”
This is excellent because you’re not just describing each line separately—you are grouping and comparing the trends.
✅ Good selection of data
You cover all three crimes and identify the major points:
- 1970 starting figures
- 1980 and 1990 growth
- 1995 peak in car theft
- subsequent decline
- burglary’s rise and fall
- emergence and growth of street robbery
This is exactly the right level of detail for Task 1.
⭐ Particularly strong
“Car theft then increased steadily, reaching 0.8 million in 1980 and 1.0 million in 1990, before peaking at 1.6 million in 1995.”
This is excellent because you combine trend + intermediate figures + peak in one efficient sentence.
Coherence & Cohesion
Your structure is extremely effective:
Introduction → Overview → Car theft → Burglary + street robbery
The information progresses logically.
Good cohesive devices
You use:
- “Overall”
- “while”
- “In 1970”
- “then”
- “before”
- “It subsequently”
- “House burglary”
- “It then”
- “after which”
- “throughout”
They are used naturally rather than mechanically.
Strong paragraphing
Your paragraphs each have a clear purpose. There is no unnecessary fifth paragraph or excessive separation of ideas.
Band 8.
Lexical Resource
This is one of the strongest features of the report.
Excellent vocabulary
“incidence”
“prevalent”
“dramatic rise and fall”
“less pronounced”
“comparatively uncommon”
“peaking at”
“declined”
“climbed to”
“falling gradually”
“surged”
These are highly appropriate for describing statistical trends.
Particularly good phrase
“House burglary followed a similar, though less pronounced, pattern…”
This is sophisticated because you compare the shape of the trends while acknowledging the difference in magnitude.
Grammatical Range & Accuracy
Your grammatical control is excellent.
Strong complex sentence
“Overall, car theft was consistently the most prevalent crime and experienced the most dramatic rise and fall.”
Strong comparison
“House burglary followed a similar, though less pronounced, pattern, while street robbery remained comparatively uncommon…”
Strong sequencing
“It subsequently declined to around 1.0 million by 2005.”
Strong subordinate structure
“Street robbery recorded almost no cases until 1990, after which it increased steadily…”
These structures demonstrate good control of complex grammar.
I don’t see any significant grammatical errors.
Band 8.
🔍 Detailed Paragraph Assessment
Introduction
“The line graph illustrates changes in the incidence of car theft, house burglary and street robbery in England and Wales between 1970 and 2005.”
Very good.
You clearly identify:
- what is measured
- three categories
- geographical area
- time period
One small improvement would be “the incidence of” is slightly formal but perfectly acceptable.
Overview
This is arguably your strongest paragraph.
You identify:
- The consistently highest crime
- The biggest fluctuation
- The similar burglary trend
- The relatively low street-robbery figures
That’s an excellent overview.
Band 8–9 quality.
Car theft paragraph
Very effective.
You establish the initial comparison:
“0.4 million cases, twice the figure for house burglary…”
Then track the progression through the major years and identify the peak.
This is efficient data reporting.
You don’t waste words on insignificant annual variations.
Burglary + street robbery
Good comparison.
The sentence:
“It then climbed to roughly 0.7 million in 1995, before falling gradually to 0.5 million in 2005.”
is particularly good because it describes the entire second half of the trend efficiently.
For street robbery, you identify the key turning point:
“after which it increased steadily…”
Again, good selection.
.
3 Comments
RosemaryChinomso
August 24, 2026Can we use brackets in the introduction?
admin
August 25, 2026No, please do not use bracket
Saheed Adebayo Hassan
October 9, 2026The analysis was perfect but needs a summary of all the reports.