

Example
You should spend about 20 minutes on this task.
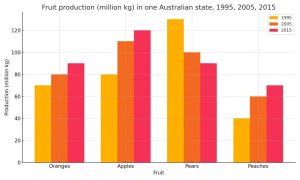
The Bar Chart Shows the Production of Fruits by Weight in the years of 1995, 2005 2015
Summarise the information by selecting and reporting the main features and make comparisons where relevant.
Write at least 150 words.
Model Answer
The bar chart illustrates the amount of fruit produced, measured in million kilograms, in an Australian state in 1995, 2005 and 2015.
Overall, apple production increased considerably throughout the period, while pear production followed the opposite trend. Meanwhile, oranges and peaches experienced steady growth. Apples became the most highly produced fruit by 2015, whereas peaches remained the least produced.
In 1995, pears were the leading fruit, with production reaching approximately 130 million kg. This was followed by apples at 80 million kg, while oranges and peaches stood at around 70 and 40 million kg respectively. By 2005, pear production had fallen to 100 million kg, whereas apple production rose sharply to 110 million kg. Orange and peach production also increased to 80 and 60 million kg.
In 2015, apples recorded a further rise to 120 million kg, becoming the highest-producing fruit. Orange production also climbed to 90 million kg. In contrast, pears declined further to 90 million kg. Peaches showed the most consistent upward trend, increasing from 40 million kg in 1995 to 70 million kg in 2015.
Break down
Task Achievement
✅ What you did well
- You have a clear introduction that accurately paraphrases the task:
“The bar chart illustrates the amount of fruit produced…”
- Your overview is excellent. You identify the major trends rather than simply repeating individual figures:
- Apples increased considerably.
- Pears declined.
- Oranges and peaches increased.
- Apples became the highest-producing fruit.
- Peaches remained the lowest.
- You selected the most important data rather than describing every number mechanically.
- You made appropriate comparisons:
- Pears vs apples in 1995.
- Changes between 1995 and 2005.
- Apples vs pears in 2015.
- The overall increase in peaches.
- Your figures are integrated naturally into sentences instead of being presented as a list.
Coherence & Cohesion
✅ Strengths
Your organisation is very good.
You use the standard and effective structure:
- Introduction
- Overview
- 1995–2005 details
- 2015 details
This makes the report very easy to follow.
Your paragraph progression is also logical:
“In 1995…”
“By 2005…”
“In 2015…”
These time markers clearly guide the reader through the data.
You also use cohesive devices appropriately:
- “Overall”
- “Meanwhile”
- “In 1995”
- “This was followed by”
- “By 2005”
- “whereas”
- “In contrast”
Importantly, you don’t overuse linking words, which is a common problem in IELTS writing.
Lexical Resource
This is one of the strongest aspects of your writing.
✅ Good vocabulary choices
You use a good range of Task 1 expressions:
- “illustrates”
- “amount of fruit produced”
- “increased considerably”
- “followed the opposite trend”
- “steady growth”
- “highly produced”
- “leading fruit”
- “reaching approximately”
- “rose sharply”
- “climbed”
- “declined further”
- “consistent upward trend”
You also avoid excessive repetition of “increase” by using:
- increased
- rose
- climbed
That’s good lexical flexibility.
Grammatical Range & Accuracy
Your grammar is very strong.
✅ What you demonstrate
You use a good range of structures, including:
Complex sentences:
“Overall, apple production increased considerably throughout the period, while pear production followed the opposite trend.”
Contrast structures:
“By 2005, pear production had fallen to 100 million kg, whereas apple production rose sharply…”
Participial structures:
“Apples recorded a further rise to 120 million kg, becoming the highest-producing fruit.”
Relative/complex structures:
“Peaches showed the most consistent upward trend, increasing from 40 million kg…”
Your verb tenses are also appropriate for historical data.
Very few grammatical problems
I don’t see any significant grammatical errors that would seriously affect your score.
The main issue is not grammar but naturalness/word choice, particularly:
“most highly produced fruit”
Change it to:
“highest-producing fruit.”
Leave a Reply