

Example
You should spend about 20 minutes on this task.
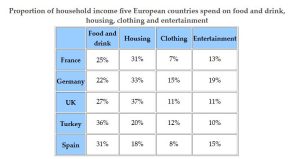
The table illustrates the proportion of monthly household income five European countries spend on food and drink, housing, clothing and entertainment.
Summarise the information by selecting and reporting the main features and make comparisons where relevant.
Write at least 150 words.
Model Answer
The table illustrates the proportion of monthly household income that people in five European countries spend on four categories: food and drink, housing, clothing and entertainment.
Overall, housing accounts for the largest share of expenditure in France, Germany and the UK, whereas food and drink represents the greatest proportion of spending in Turkey and Spain. By contrast, clothing and entertainment make up considerably smaller shares in all five countries.
Housing is the biggest expenditure category in France, Germany and the UK, accounting for 30%, 33% and 37% of income respectively. These figures are higher than the proportions spent on food and drink, which are approximately one quarter in each country. The opposite pattern can be seen in Turkey and Spain, where around one third of income is spent on food and drink, compared with only about one fifth on housing.
Spending on clothing and entertainment is generally lower. France and Spain allocate less than 10% to clothing, while the other countries spend between 11% and 15%. Germany spends the most on entertainment, at 19%, while the UK and Turkey spend roughly half this amount. France and Spain occupy the middle range.
Break down
Task Achievement
✅ Excellent overview
Your revised overview is much more precise:
“housing accounts for the largest share of expenditure in France, Germany and the UK, whereas food and drink represents the greatest proportion of spending in Turkey and Spain.”
This is exactly the kind of high-level comparison required.
You also identify the secondary categories:
“clothing and entertainment make up considerably smaller shares in all five countries.”
Excellent.
✅ Strong grouping
Rather than describing five countries separately, you group them into:
Housing dominant: France, Germany, UK
Food/drink dominant: Turkey, Spain
This is excellent Task 1 technique.
✅ Good data selection
You provide key figures:
- Housing: 30%, 33%, 37%
- Food/drink: approximately 25%
- Turkey/Spain: approximately ⅓ vs ⅕
- Clothing: <10% vs 11–15%
- Germany entertainment: 19%
This gives sufficient evidence for your comparisons.
Coherence & Cohesion
Your organisation is excellent.
Structure
Introduction: What the table shows
Overview: Main patterns
Body 1: Housing + food/drink
Body 2: Clothing + entertainment
This is a very effective structure.
Strong cohesive devices
You use:
- “Overall”
- “whereas”
- “By contrast”
- “These figures”
- “The opposite pattern”
- “while”
- “where”
- “Spending on”
- “In comparison”
The progression is smooth and easy to follow.
Excellent comparison
“The opposite pattern can be seen in Turkey and Spain…”
This is a very effective way to introduce the contrasting group.
Lexical Resource
Your vocabulary has improved significantly from the previous version.
Strong expressions
“largest share of expenditure”
“greatest proportion of spending”
“make up considerably smaller shares”
“biggest expenditure category”
“accounting for”
“allocate less than 10%”
“middle range”
These are all appropriate academic expressions.
Excellent variation
You don’t repeatedly use spend:
- accounts for
- represents
- proportion
- expenditure
- allocation
- make up
That’s good lexical flexibility.
Grammatical Range & Accuracy
Your grammar is now very clean.
Strong structures
“Housing accounts for the largest share of expenditure in France, Germany and the UK, whereas food and drink represents…”
Excellent contrast.
“These figures are higher than the proportions spent on food and drink…”
Good comparative structure.
“The opposite pattern can be seen in Turkey and Spain, where…”
Excellent passive construction + relative clause.
“Germany spends the most on entertainment, at 19%, while the UK and Turkey spend roughly half this amount.”
Very natural complex comparison.
🔍 Detailed Examiner Assessment
Introduction
“The table illustrates the proportion of monthly household income that people in five European countries spend on four categories…”
Excellent paraphrase.
It’s clearer than your previous introduction.
Overview
This is now Band 8-level.
You identify:
- the dominant category for three countries
- the dominant category for two countries
- the smaller categories across all countries
No unnecessary numbers.
Exactly what you want.
Body Paragraph 1
This is your strongest paragraph.
You provide the three housing figures:
“30%, 33% and 37%”
Then compare them with food/drink.
Then introduce the contrasting countries.
The sentence:
“The opposite pattern can be seen in Turkey and Spain…”
is particularly effective.
Body Paragraph 2
This is much better than your previous version.
You clearly establish that clothing and entertainment are smaller categories.
You then compare:
Clothing: France/Spain vs other countries
Entertainment: Germany vs UK/Turkey + France/Spain
That’s good organisation.
Leave a Reply